Collapsing the Performance Triangle
The performance triangle for runtimes such as Java are based on footprint, throughput, and latency. The premise is, you can only one or two these metrics and that will be at the expense of the others.For example, reducing memory footprint will increase latency.
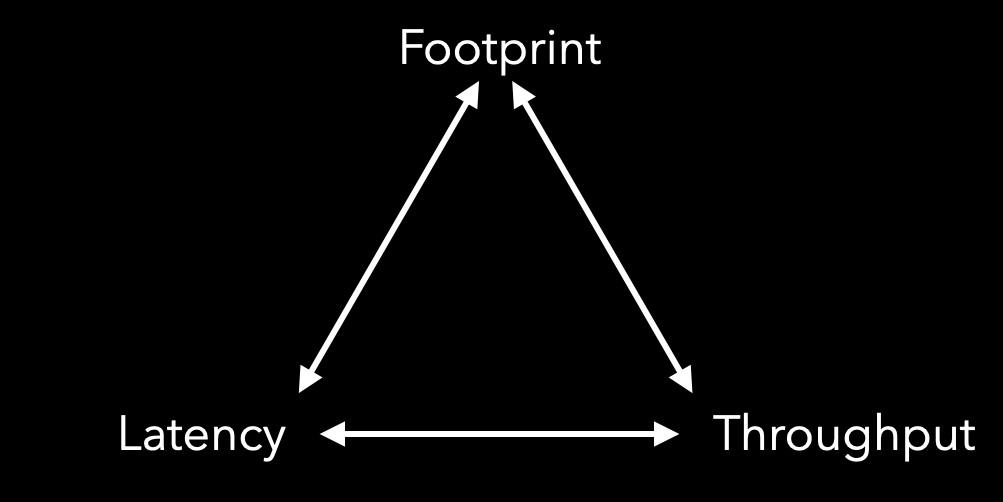
Performance Triangle
Although this premise is overwhelmingly accepted, it is rarely questioned. Unsurprisingly, when it is questioned, it generally quickly falls down. This is because the premise fails to fully take into account the linkage between latency, throughput and hardware footprint. Let’s start by looking at the relationship between latency and throughput.
Little’s Law
John Little formulated Little’s law in 1961. It states that “the average number of customers in a stable system (over some interval) is equal to their average arrival rate, multiplied by their average time in the system.” There are several corollaries to this law of which we will use the 3rd with defines the relationship between service time and throughput. We can start with the mathematical expression of the above statement along with the 3rd corollary.
Little's Law  : L = λW

3rd corollary : T = 1 / μ

Latency       : W = L * μ

where

L = number of requests in the system
λ = arrival rate
W = latency
T = throughput
μ = service time
Starting with original definition, lets explicitly state the relationship between latency and throughput.
L = λW
  = λLμ     (substitute Lμ for W from above)
1 = λμ      (reduce L on both sides)
λ = 1/μ     (normalize for λ)
Returning to the original formula, substituting λ for T and rearranging to solve for W yields W=L/T
Putting this into practice, if a system has 100 requests in-flight with a throughput of 50 requests per second, the average latency will be 100/50 equal to 2 seconds. The service time is 1/50tps = 20ms.
Decreasing service time to 10ms will increase throughput to 1/0.01seconds = 100 request per second. To keep the system stable, we need to keep the same conditions above where there are 50 arrivals per second. Under these conditions the number of requests in flight will be 1. Thus the response time of the system will be 10ms.
The point here is that there is a direct correlation between latency and throughput. Throughput limits the number of requests that can be processed for a unit period of time. As the arrival rate approaches this rate limiting activity (bottleneck) of your application, requests will be stalled (queued) before they can be services. The amount of stall time, as described by Little, is the service time for the bottleneck times the number of requests waiting plus 1. To optimize for throughput you must reduce the service time for the rate limiting activity in your application. The point here is that there is a direct link between latency and throughput meaning, when you pick one, the other comes with it. This, collapses the triangle to a single thing between latency/throughput and memory.
Managed Memory’s Impact on Latency
To collapse the line into a point we have to look at the relationship between memory and latency or throughput. The assertion is that as you decrease the size of memory, garbage collection will run more frequently. At issue is that current garbage collectors (GC) will perform some portion, up to all, of the work in mutual exclusion with the application. The pause in application progress generally shows up as tail latency. If the collector works concurrently, then that effect will impact all latencies. The confusion here is that GC induced latency doesn’t look like the latency that comes when requests are waiting in a queue for a resource at designated points in a workflow. Instead, GC runs at random times for random durations. However, the effect is the same in that application threads are stalled waiting from memory to become available. The latency from the concurrent portion of a GC cycle looks more like noise than anything else and as such is difficult to detect or otherwise quantify let alone tie it to a source.
All details aside, the result is, GC overheads add to latency and as we’ve already seen, adding to latency decreases throughput. The question is, what happens when we tune for memory to improve GC performance?
Memory Tuning’s Impact on the Triangle
GC pause and concurrent cycles times reflect how much work the collector has been tasked with. One factor that has a big impact on workload is the size of live set. Live set is defined as the volume of data that is constantly in heap. In the case of generational collectors, this would be the amount of data left in tenured after a collection of that space. Tuning the application to use more space efficient data structures will reduce footprint. This generally reduces the burden on the collector. This translates into shorter cycle times and that translates to less GC interference implying smaller impact on overall latency. As previously mentioned, lower latency will improve throughput assuming that GC is the bottleneck.
The next factor to consider is the rate at which the application churns through memory. For generational collectors, almost all allocations are realized in Eden. The faster the app allocates the quicker it fills Eden the more often the collector has to clean and that of course, impacts latency and by extension, throughput. The levers to reduce frequency in this case are to increase the size of Eden or reduce the allocation rate.
Of these choices, the one that consistently works best, by-far, is to reduce the allocation rate. Reducing the allocation almost always reduces latency (read increases throughput) and reduces footprint. The result is better memory efficiency with a smaller memory footprint collapses the line into a single point, which I guess could be a very very small triangle.
Checkout my workshops if you want to learn more about how to reduce memory footprint, tame allocation rates or tune GC. You can find them here or live on Safari.