Garbage Collection and P99 Latency
The JVM’s managed memory systems consist of mutator threads and garbage collectors all working in Java Heap. Mutator thread (also known as mutator) is synonym for an application thread. The slight difference is that a mutator refers to a thread that mutates (modifies) memory in Java heap. More importantly, mutators allocate and eventually they will have allocated all available memory in Java Heap. At this point, it is the role of the garbage collector to recover all of the allocated memory making it available to the mutators once again. As it has been said, this gives the program the illusion that it has an infinite amount of memory to work with. The reality is, Java Heap is a shared data structure and in order for multiple threads to share it safely, there needs to be some access protocol in place that guarantees mutually exclusive access. The upside of mutual exclusivity is data won’t be corrupted. The direct impact is end user requests in flight will accumulate “dead time” while waiting for the mutually exclusive resource becomes available. It is this “dead time” that creates tail latencies. With garbage collection, this dead time is referred to as stop-the-world pause time.
Tail Latency
As a reminder, tail latency refers to the high latencies that are infrequently seen. For example, looking at the set of timings in ms { 1, 1, 1, 2, 2, 2, 2, 3, 3, 8}, the 90th percentile is 8 as 90% of the timings are smaller. For P90, 8 ms represents tail latency.
A Tail Latency Example Using An Ideal System
While there are no hard and fast numbers for GC frequency and duration, the numbers that I commonly see are in the range of 99%. That is in 60 seconds of runtime, 600ms will be spent paused. For a system running at 1000 TPS with a medium latency of 20ms, we can estimate we can estimate that there will be 20 requests in flight at any point in time. The question is, what does the tail latency picture look like? That depends on the frequency of GC cycles. For example, if there is 1 600ms pause in 60 seconds, then you will see 60,000 requests hit the system. In our highly idealized system, 59,380 requests will complete in 20ms leaving 20 requests to complete within 620ms and 600 requests to complete in 620ms. What happens if we have 2x300ms pauses?
In the case of 2x300ms pauses, the system will still have 60,000 requests hit the system in the 1 minute but only 57,960 will complete in 20ms. Of the other 1240 requests, 40 will complete within 320ms while the remaining will take 320ms. If we consider the 3x200ms pause situation, the latency for 60,000 requests will be distributed as 56,340, 60, and 3600 corresponding to 20ms, within 220ms and 220ms respectively. The trend is clear, more shorter pauses reduced the tail latency from 620ms to 220ms. Does this mean we should favor configurations that yield more frequent but shorter pauses? This is where things get a little bit more complicated.
With the first configuration, the probability of an individual request experiencing dilated latency is 620/60000 ~= 1.03%. With the two other configurations, the probability rises to 2.1% and 6.1% respectively. Remember, this is for a single request. Transactions almost always consist of several requests and that is what complicates the picture. To calculate the probability of seeing a not very long transaction is 1 - probability of seeing a long request all raised to the power of the number of requests making up the transaction. For example, in this first case the probability of seeing a long request is 1.03%. If there are 10 requests in a transaction, the probability of not seeing a long latency is (1 - 0.0103)^10 ~= 90%. Implying that 10% of your user population will experience at least 1 tail latency event. If we look at the last scenario, the numbers would be (1 - 0.061)^10 ~= 53%. Implying that about half our your user base will experience at least 1 tail latency event. I say at least 1 because every request has a probability of seeing a tail latency event which translates to, a transaction may experience more than 1 tail latency event. The chart below shows trend lines for each of these 3 examples.
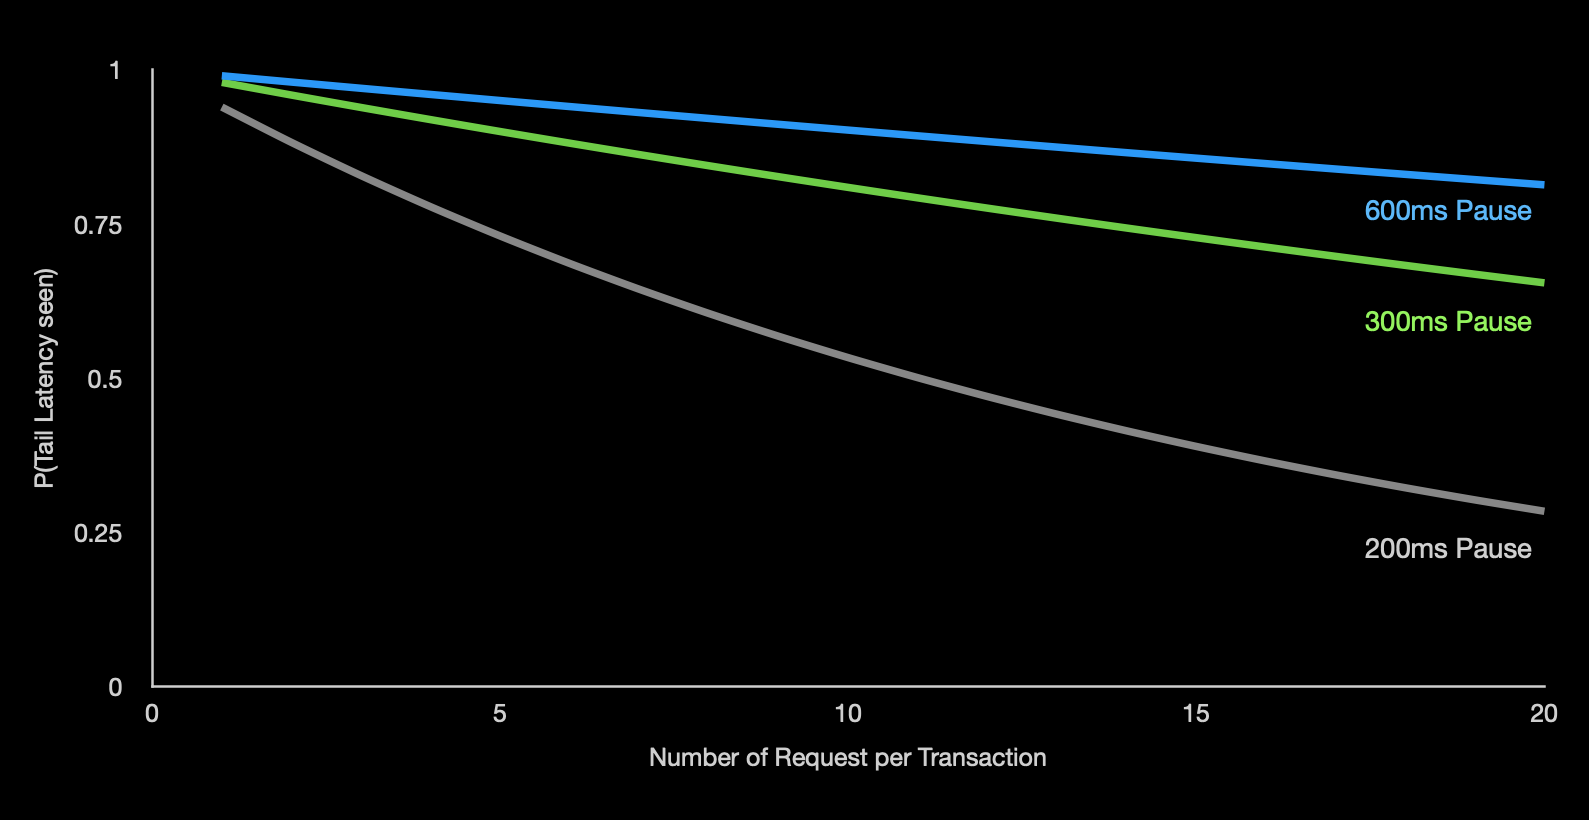
Probability of experiencing tail latency
Real World Example
Of course a better solution would be to reduce both frequency and duration. The chart below demonstrates the impact on latencies on a live production system where GC tuning was applied.
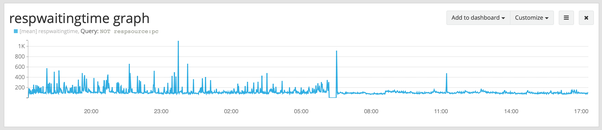
Response time over time
As can be seen in the chart, there is a dramatic change in the performance of the system around 6am. At that time, the system administrators rolled a change that reconfigured garbage collection. What was causing all of the noise prior to 6am? All of the noise was due to the premature promotion of transient data. This condition increased both the frequency and duration of garbage collection. This problem is surprisingly very commonly seen in well more than half of the Java applications running in production today. Unfortunately it isn’t a problem that isn’t visible with good tooling. unless you have the proper tooling. Even then, the problem hideously hides in many subtle ways that can only be seen with calculations made using indirect measures. For example, looking at the frequency of full collections coupled with the level of recovery hints at hidden premature promotion.
While the common solution to solve this type of problem is to increase the heap size, in this case no extra heap was needed. What was needed was a re-proportioning of the individual memory pools. Even better, after solving the premature promotion problem it was determined that the heap size could be reduced. Not only does the app now perform better, it takes less memory and that equals a significant savings in operating costs.
How about your App?
This isn’t a one-off situation. I’ve been looking at GC logs from a large number of applications and as I mentioned, this data leads me to estimate that more than half of deployed applications suffer from poor memory provisioning. Please reach out if you’re interested discovering which half of the memory provisioning spectrum your applications falls into.