Is your reported p99 wrong?
Last Thursday night/Friday morning I was out at a nearby beach on the Okanagan lake. As much as I wished the reason for being there was a late night party, what I and the others around me were engaged in was watching in horror as a gigantic wild fire jump up a cliff from behind a ridge line and then start dancing down the mountain. I don’t know how but fire fighters were able to stop the advancing fire as it raced to enter the neighborhoods just below the top of the ridge but they did. The report so far is that 200 homes have been lost in that are with many more damaged. But without the herculean efforts made by fire fighters, that number would have been much much much higher. I tip my hat to these brave men and women.

Wild fire on Rose Valley ridge line
Where is the latency
In a much less dramatic activity, I was just recently looking at some latency numbers that seemed suspicious. The p99 was being reported at 42ms whereas the average GC pause was 131ms. Given that GC pauses generally inflate tail latencies, I questioned the veracity of the value being reported and dug into calculating an expected p99 value.
What I suspected was happening was that the queries that arrived while the JVM was in the heat of a GC pause would be stalled and this stalled the start of the latency timer until after the GC pauses was complete. The net result is that instead of recording this as tail latency event, the latency would be void of the GC pause time and thus would count towards the lower end of the latency picture. To prove this all that was needed was to show that the expected p99 value was significantly greater than the reported p99 value.
Measurements Summary
The first step was to ensure that we had a window of latency data that was aligned with GC log data. Once the start and end was set, the base measures for the analysis could be calculated. These measures can be found in the table below.
| Run duration | 7 hours, 55 minutes/28,500 sec |
| TPS | 500 |
| Reported p50 (ms) | 2 |
| Reported p99 (ms) | 42 |
| Total GC Pause Time (sec) | 300.839 |
From these numbers we can start to calculate some of the basic information needed for the estimation.
- Total number of queries arriving = 500 tps * 28500 = 14,250,000
- Total number of queries @>p99 latency = 14,250,000 * 0.01 = 142,500
- Total number of queries stalled by GC = 300.839 * 500 = 150,419
As can be seen, these calculations show that the number of queries that arrived during a GC pause is slightly greater than the number of queries that make up the group of p99+ latencies. The next step is to estimate the expected latency directly attributable to GC pauses. The table below is a breakout by GC event type of the number of GC events, pauses times and total pause time.
Derived Values
Before we get on with it there are a couple of decisions that need to be made. The first is, does every captured query get tagged with the entire pause time or should the pause time be distributed across all queries and if so, what does that distribution look like? The assume here is that queries arrive at a constant interval over the duration of the pause. Thus the average amount of latency experienced by any query would be the half the average pause time.
The next decision is should the query latency be added to the expected latency and if so, what latency value should be used. Since we’re trying to calculate an expected p99 value it feels necessary that query latency be a component of the calculation. However, the reported latencies range from 2ms on the lower end to 42ms on the higher end of spectrum. If a higher the p value is selected then it’s more likely that this value already contains a significant amount of GC pause. This implies a lower p-value should be selected. However, the lower p-values likely are missing the other sources of latency (noise) that need to be accounted for. The compromise was to select the p50 value of 6ms.
- Young latency = 131 / 2 + 6 = 71.5ms
- Initial Mark latency = 129 / 2 + 6 = 70.5ms
- Remark = 16 / 2 + 6 = 8ms
- Mixed = 152 / 2 + 6 = 82ms
Recall that the p99 represents the 142,500 queries that have the longest latencies. In order of highest to lowest latency, we have 84680 Mixed, 51559 Young, and 12656 Initial marks totalling 148,895. As it is the Initial Mark collections that push the query counts over the 142500 threshold, we can use the latency value of 70.5ms as the expected p99 value.
Discussion of results
The queries stalled by GC make up p98.9 of the reported latencies. The estimated p99 value of 71.5ms vs the reported value of 42ms suggests that much of the GC pause time is missing from the calculation. How could this have happened? The answer is in how have the queries been timed. Let’s consider the case where a query enters the system, a timer is started and then stopped just before the query leaves the system. The diagram below is a timeline with GC mixed in.
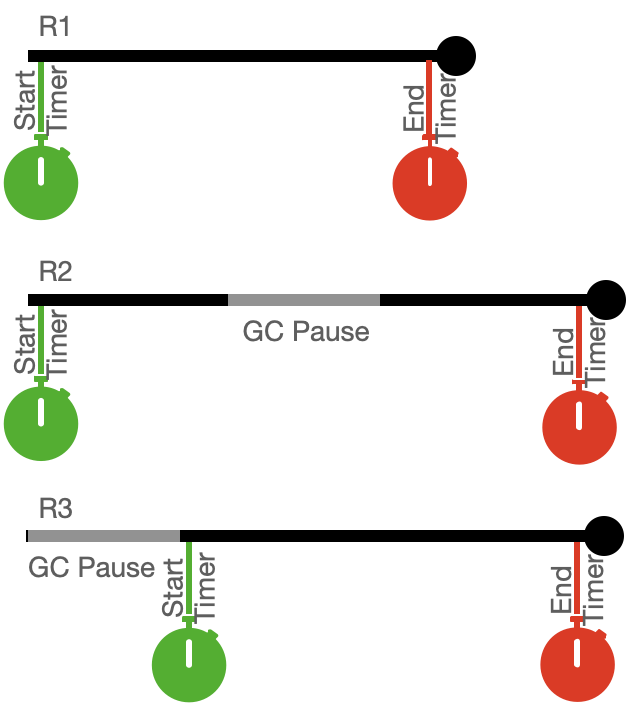
GC Pause intermixed with Query Timings
As is depicted here, R1 enters the system, a timer is started and before completion the timer is stopped. Query latency is calculated by subtracting the start time from the end time. A little bit is missed at the beginning and the end but that’s ok. The picture with R2 is pretty much the same but the latency also includes a GC pause which is also ok. The fun starts with R3.
With R3, the query arrives at the server when A GC pause is in play. Once the collector finishes, R3 starts the time, does it’s thing and then the timer is stopped. In this case the reported time is the same as that reported by R1. However, the real latency should include the GC pause time giving it the same latency as R2.
What if….
Lets play a game with the following assumptions. The system is completely quiet in that there will no interruptions other than those caused by GC. Let the response time is 2ms at a tps of 500, GC throughput be 1% with a constant pause time of 10ms. If we look at the system for a 1 minute period it will have received 30,000 requests (60*500). At any point in time there will be 1 request in flight (500 tps * 2ms). GC will have run for 600ms implying there is 1 GC event per second given a 10ms pause time. The number of queries interrupted by a GC pause will be 60 (the number in flight each time a GC pause starts). The number of queries delayed by a GC pause will be .6 * 500 = 300 transactions or 5 transactions per pause event.
Converting all of this to latency we get 29,640 transactions with a 2ms pause time. Since there are 60 GC events, there will be 60 transactions with a response time between 10 and 12ms. Lets assume 11ms for these values. That leaves 300 transactions partitioned into 60 different groups where the expected response time will range between 2 and 12 ms. If we evenly distribute this then the expected latencies would be 4, 6, 8, 10, and 12ms.
In summary, we have
- 29640 x 2ms
- 5 x 4ms
- 5 x 6ms
- 5 x 8ms
- 5 x 10ms
- 60 x 11ms
- 5 x 12ms
The p99 occurs at the 29700th sample. Thus the p99 should be 11ms.
If we redo the calculation with the GC pause missing from the measure, then the data would look like; 29940 x 2ms and 60 x 11ms. In this case the p99 value would be reported as 2ms.
Now what?
The challenge that I often witness is when the measures are not recognized for what they represent. More specifically, low p-values represent the “true” response time of the system whereas high p-values represent the amount of noise or interference that exists in the system. Noise will be both internal and external to the application. Garbage collection is but one source of internal noise. External noise can be from the randomness of thread scheduling sometime starving unlucky threads for CPU or it might be competition for other scarce hardware resources. Either way, knowing this helps with the interpretation of the latency data. This leads me to what I believe is the most important conclusion which is, given that all latency measures will lack precision the question should be, are the measures good enough that they can guide you to the right conclusion and drive the right decisions.
I encourage you to reach out to me if you want to learn more about performance diagnostics and tuning.